Do expensive yearlings earn back their price?
Published
Better horses cost more. That's the assumption the bloodstock market runs on. A well-bred yearling by a proven sire from a strong family can sell for 500,000 guineas. Sometimes over a million.
Does paying more actually lead to proportionally better racecourse outcomes for the money spent?
18,422 yearling sale prices from Tattersalls and Goffs (2015–2022), linked to actual UK and Irish racing careers. We measured what those horses earned, what they won, how they were rated, and whether any of it justified what was paid.
The answer is the same across every price bracket, every sale, every year in the sample. Spending more buys a better horse. It does not buy proportionally better racecourse outcomes for the acquisition cost.
What the data shows
1. Earnings rise with price — but the gap never closes
A yearling bought for 500,000+ gns earned an average of £57,885 in career prize money. One in the 20,000–50,000 gns range earned £19,254.
The purchase prices tell a different story. The 500k+ average is £887,902. The 20k–50k average is £31,826. Twenty-eight times the price. Three times the earnings.
Price bracket | Horses | Avg career earnings | Return per £1 |
|---|---|---|---|
Under 10k gns | 2,470 | £11,123 | £2.05 |
10k–20k gns | 2,838 | £15,536 | £1.10 |
20k–50k gns | 5,927 | £19,254 | 60p |
50k–100k gns | 3,822 | £24,674 | 37p |
100k–200k gns | 1,985 | £27,290 | 21p |
200k–500k gns | 1,066 | £46,576 | 16p |
500k+ gns | 314 | £57,885 | 7p |
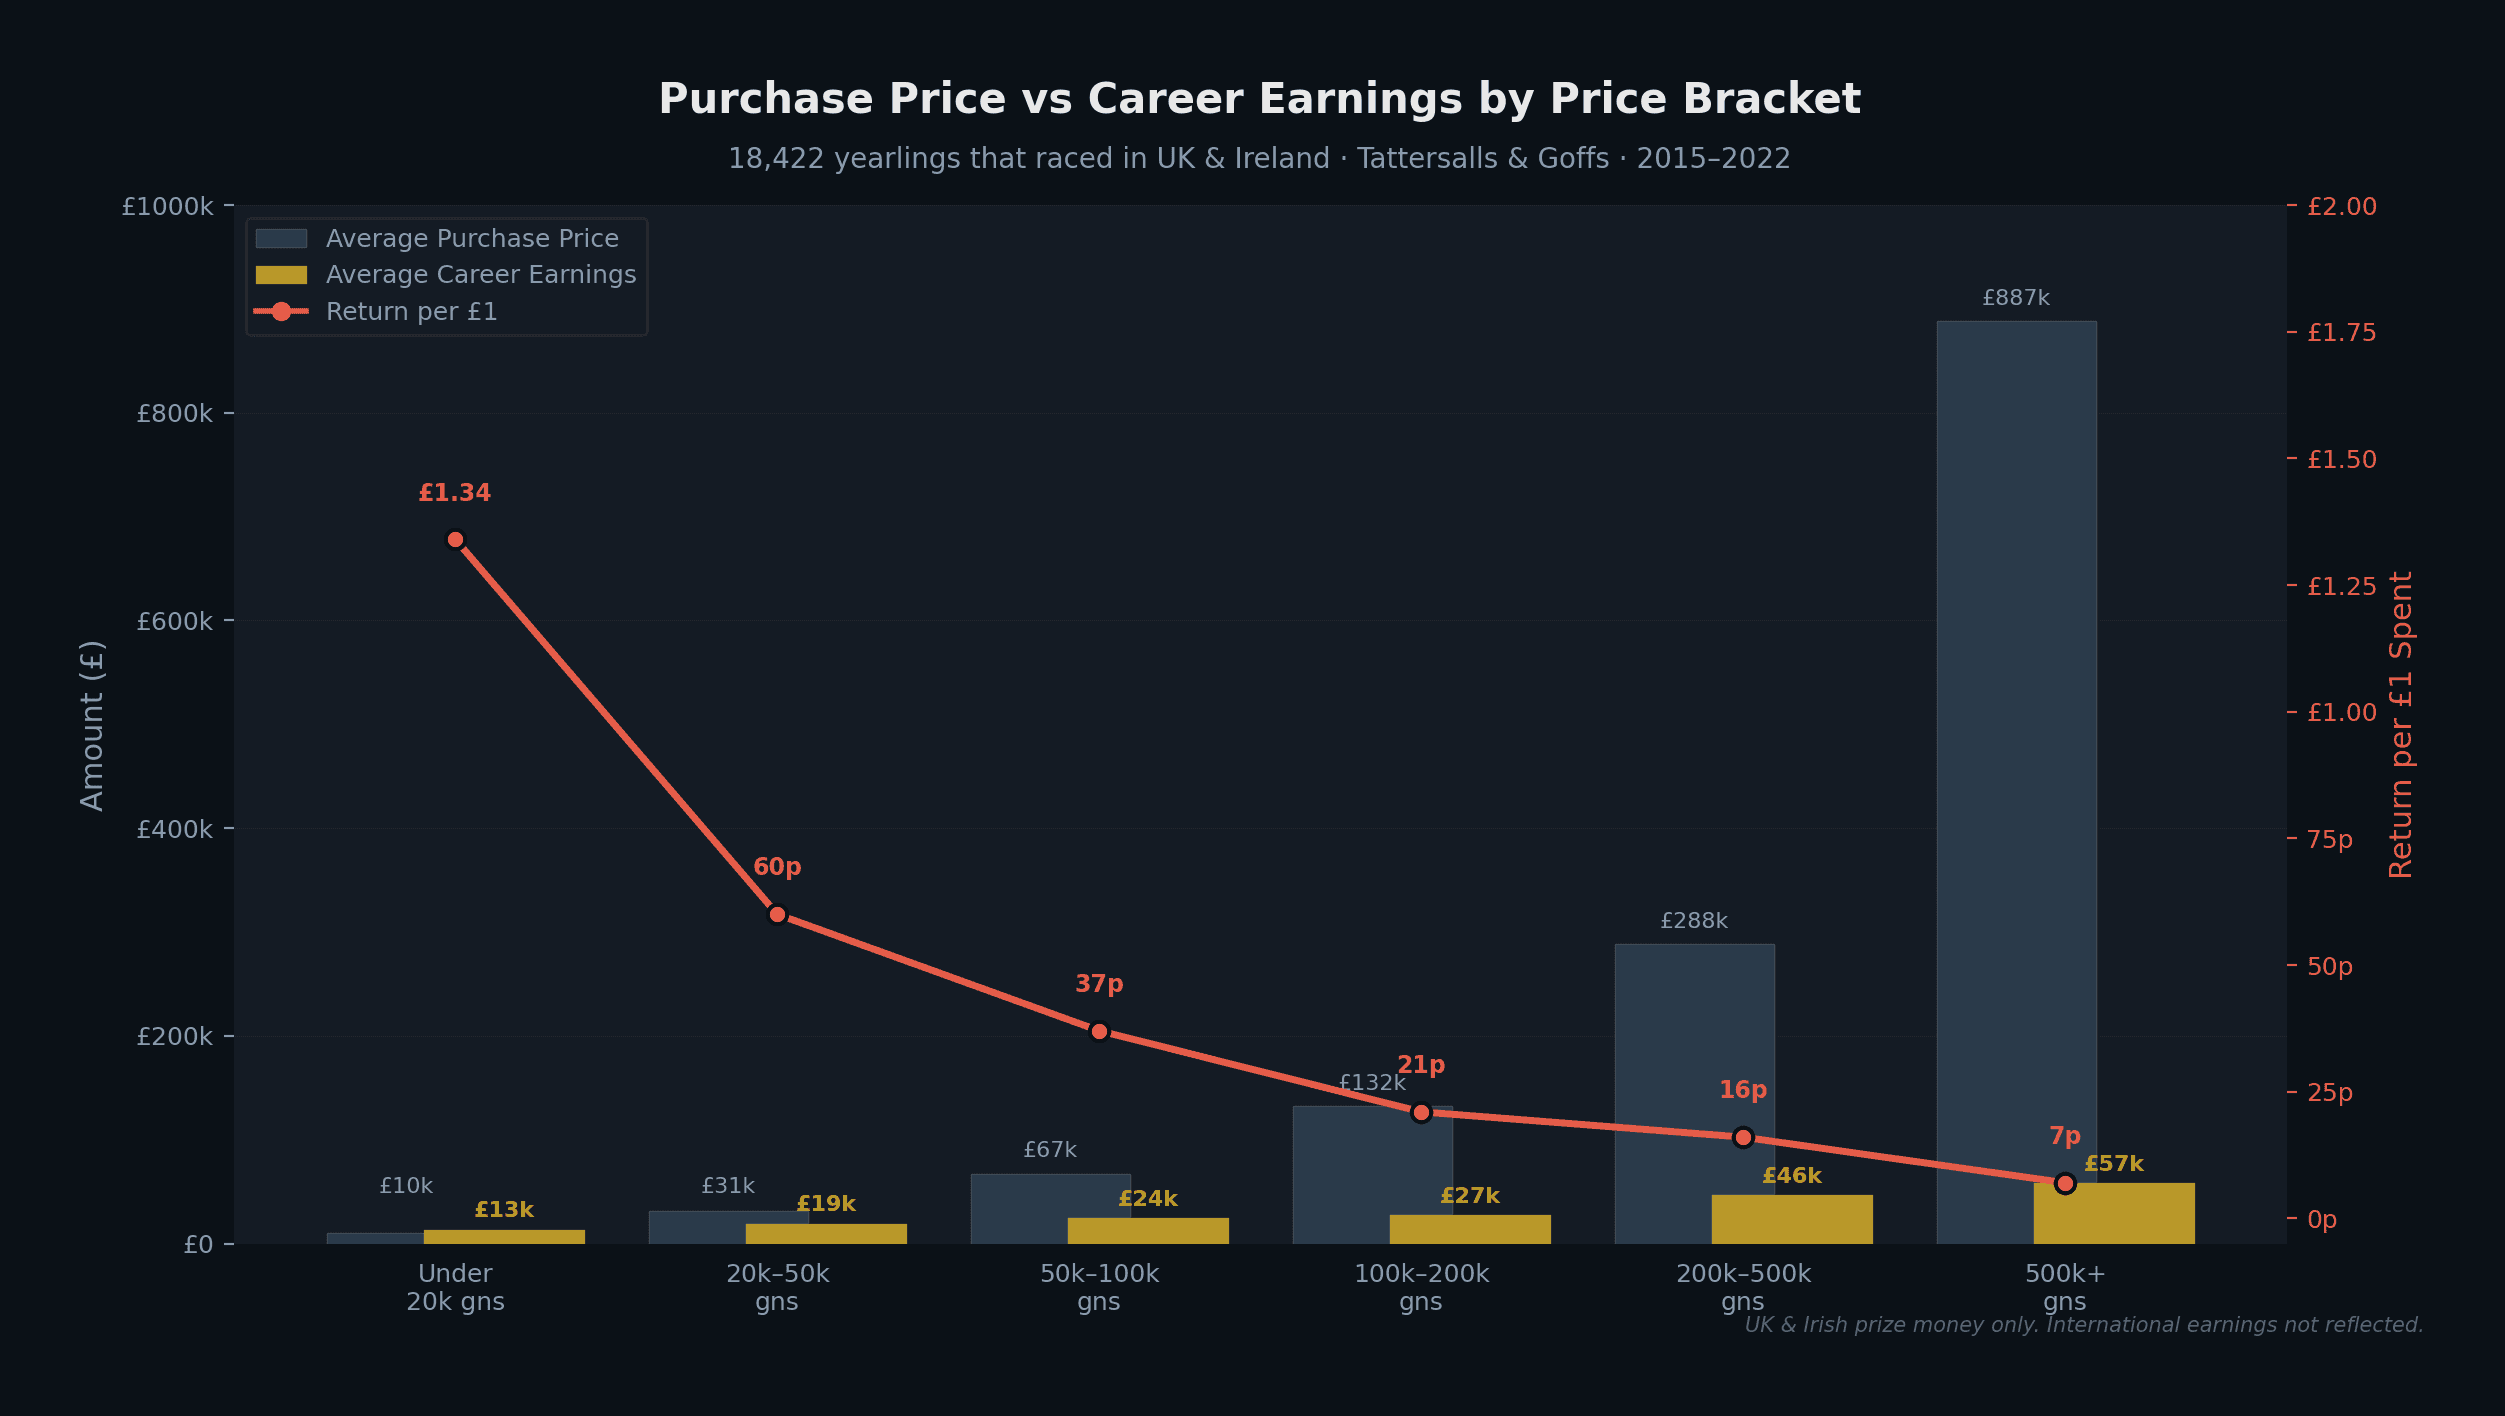
Return per £1 collapses as purchase price rises. Under 10k: £2.05 back. At 500k+: 7p.
2. Expensive horses race more — but almost none earn back what was paid
One thing does improve with price: the chance of earning any prize money at all. 67% of sub-10k yearlings earn something. At 500k+, 93% do.
Earning something and earning enough are different questions.
Price bracket | % earn any prize money | % earn back purchase price | % earn back half |
|---|---|---|---|
Under 10k gns | 67.3% | 37.7% | 46.4% |
10k–20k gns | 77.7% | 28.6% | 43.1% |
20k–50k gns | 82.3% | 16.1% | 29.9% |
50k–100k gns | 86.6% | 7.9% | 17.7% |
100k–200k gns | 88.6% | 3.3% | 10.2% |
200k–500k gns | 91.7% | 2.3% | 5.9% |
500k+ gns | 92.7% | 0.6% | 4.1% |
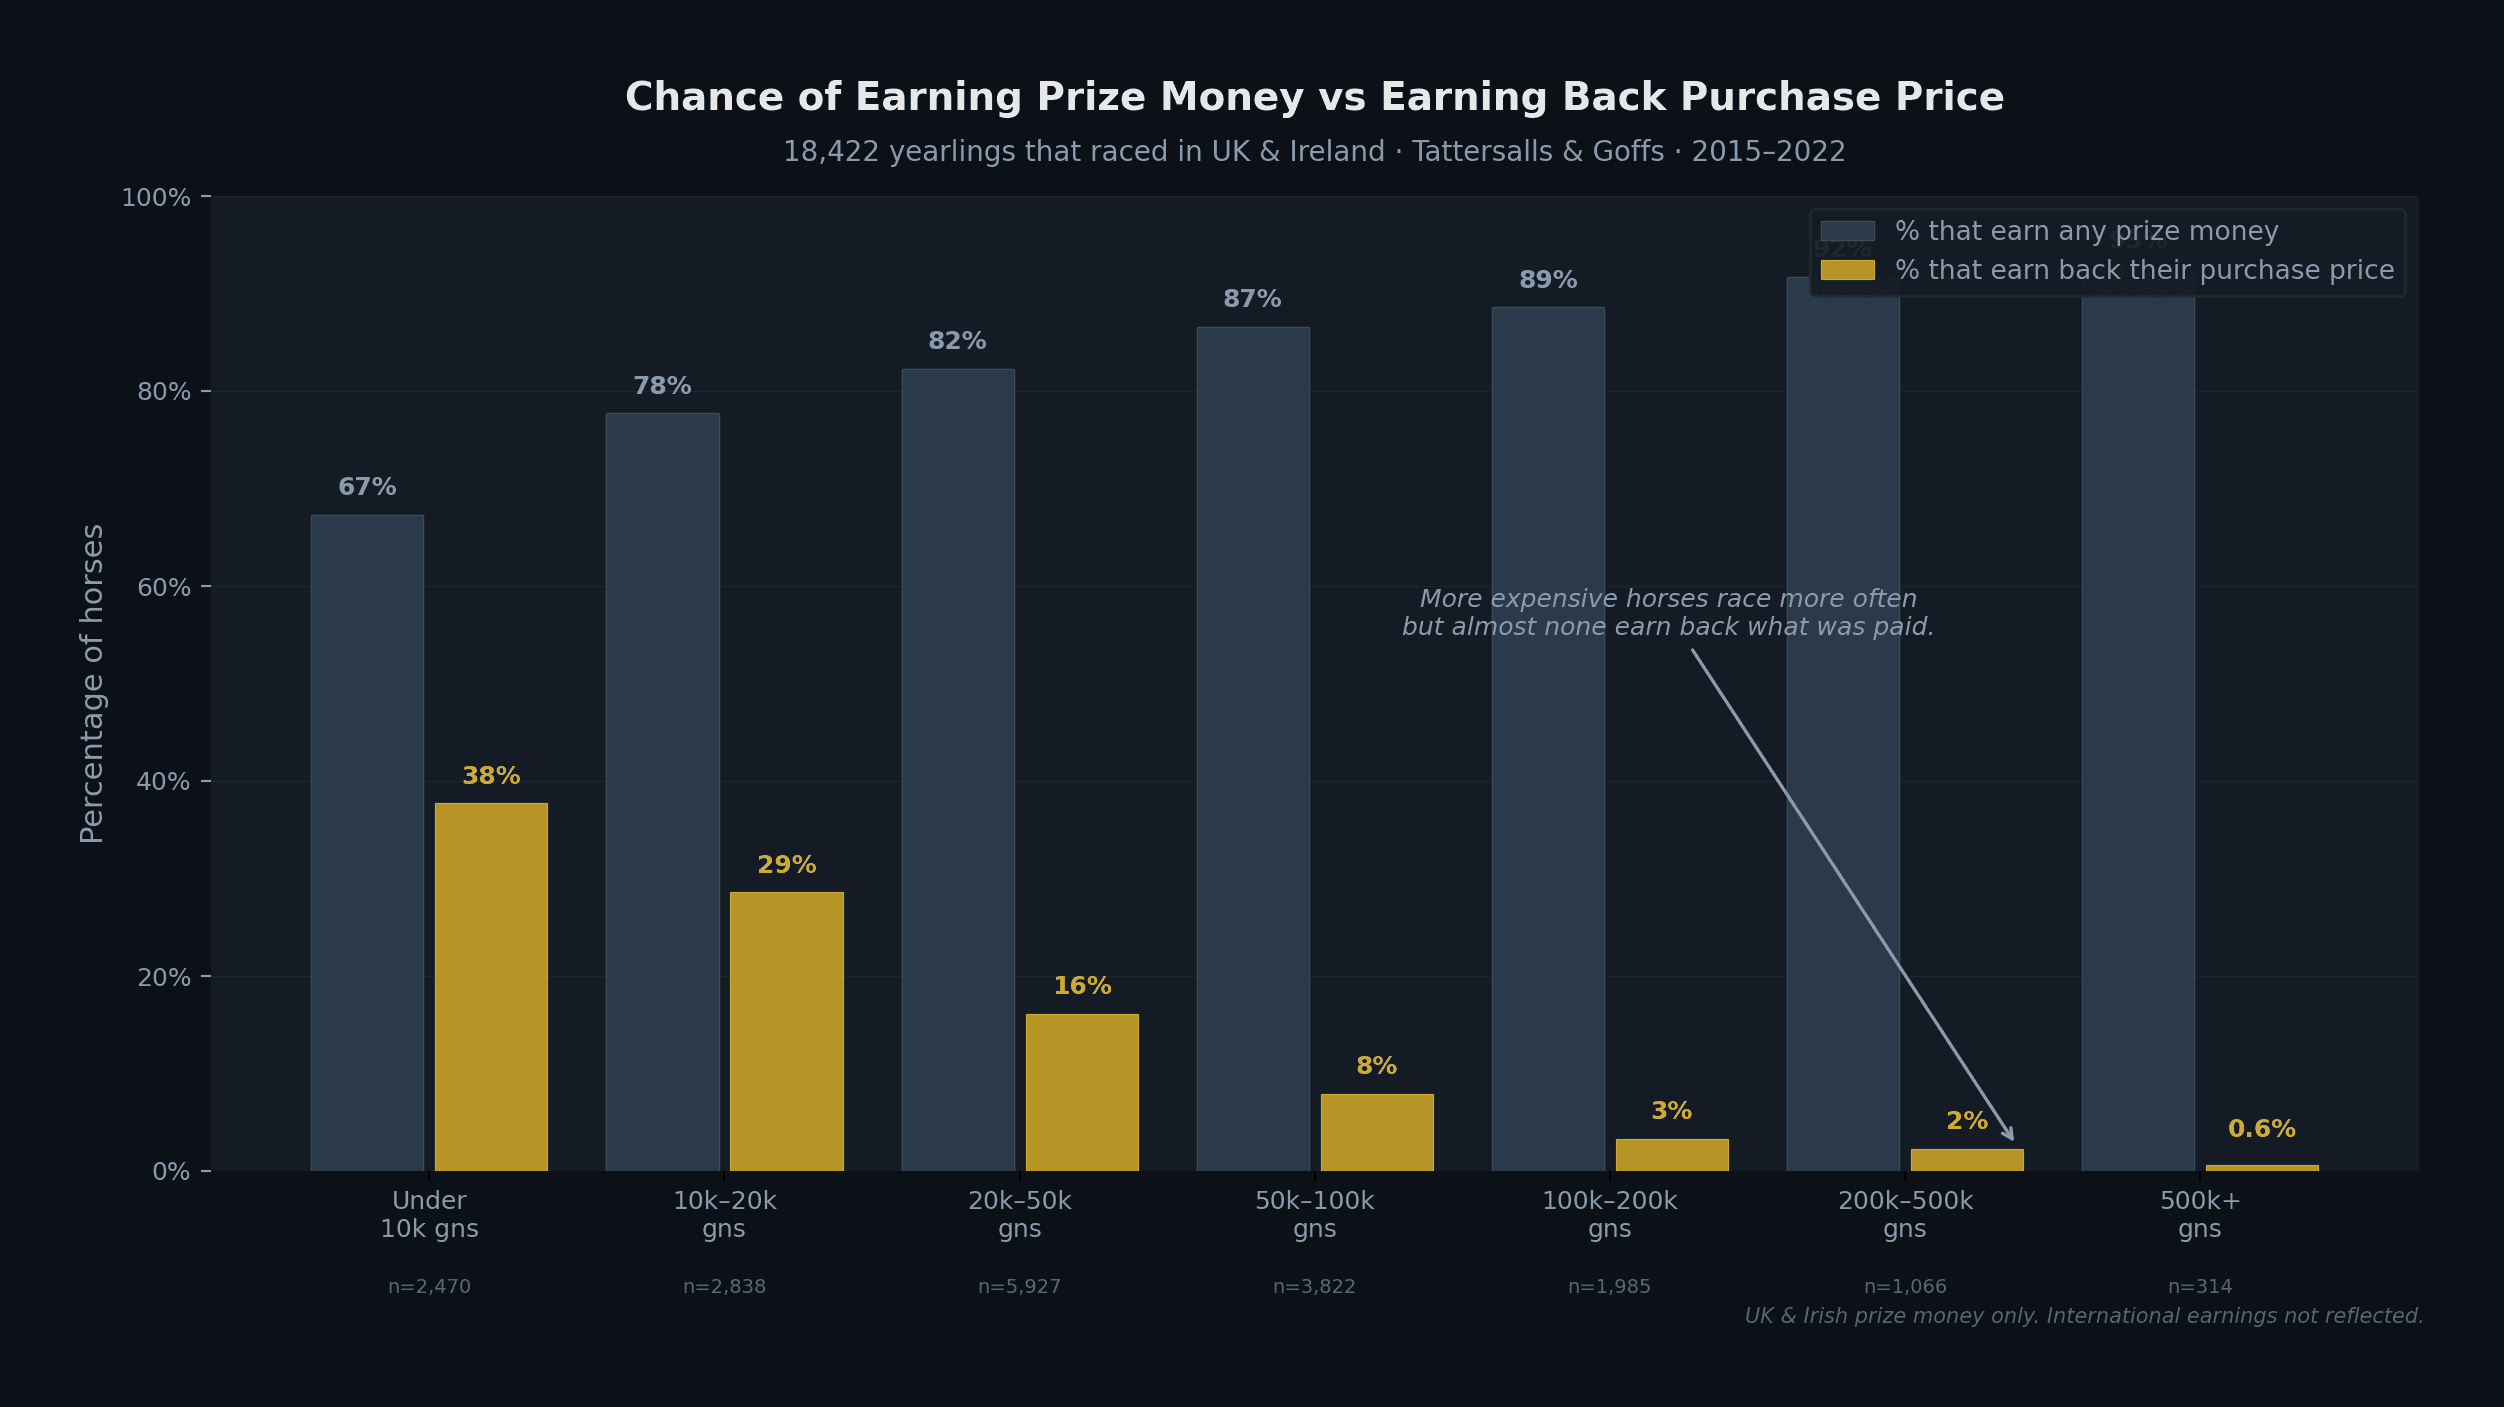
Of 314 yearlings bought for 500,000+ guineas, 2 earned back their purchase price. In the 20k–50k bracket, 1 in 6 did.
3. Quality scales with price — but each extra percentage point costs more
Expensive horses aren't just overpaid versions of cheap ones. They produce more stakes winners and higher-rated horses. That part is real.
Price bracket | % stakes winners | % rated 100+ | % rated 110+ | % Group 1 winners |
|---|---|---|---|---|
10k–20k gns | 1.4% | 2.8% | 0.6% | 0.21% |
20k–50k gns | 2.7% | 5.0% | 1.2% | 0.12% |
50k–100k gns | 4.2% | 7.7% | 2.1% | 0.44% |
100k–200k gns | 5.7% | 11.3% | 3.0% | 0.50% |
200k–500k gns | 9.4% | 18.0% | 6.1% | 1.50% |
500k+ gns | 18.5% | 30.2% | 11.8% | 2.55% |
The 500k+ bracket produces 18.5% stakes winners versus 2.7% at 20k–50k. But the price of buying that improvement rises steeply:
Price bracket | What each 1% of stakes chance costs |
|---|---|
10k–20k gns | £10,056 |
20k–50k gns | £11,787 |
50k–100k gns | £16,055 |
100k–200k gns | £23,184 |
200k–500k gns | £30,691 |
500k+ gns | £47,995 |
Below 50k, each percentage point of stakes chance costs around £10,000–£12,000. At 500k+ it costs £48,000. The quality is real. The price of that quality quadruples.
4. The diversification test
This is a purchase-budget test, not a full ownership cashflow model. It compares acquisition cost against aggregate racecourse outcomes before training fees, management fees, ownership splits, and resale proceeds are layered in.
Same budget: one expensive horse or several mid-market ones.
£300k
1 horse at £300k | 9 horses at ~£32,000 | |
|---|---|---|
Chance of a stakes winner | 9.4% | 22.0% |
Chance of a horse rated 100+ | 18.0% | 37.2% |
Expected total earnings | £46,576 | £174,533 |
£900k
1 horse at £900k | 28 horses at ~£32,000 | |
|---|---|---|
Chance of at least 1 stakes winner | 18.5% | 53.4% |
Chance of at least 1 horse rated 100+ | 30.2% | 76.1% |
Expected total earnings | £57,885 | £537,160 |
Spreading the budget increases the chances of a positive outcome on every measure at the purchase-budget level. The larger the budget, the wider the gap.
What this means
The market isn't irrational. Expensive yearlings are better horses. They earn more, win more stakes, achieve higher ratings. Buyers at the top end know what they're doing.
But the price has almost nothing to do with purchase-price efficiency. The premium largely buys prestige. It does not buy proportionally better racecourse outcomes for the money spent at the point of acquisition.
For a buyer thinking about how to allocate acquisition budget, the data points to the mid-market. Not because the horses are better individually — because spreading the same purchase budget across several better-valued horses produces stronger aggregate outcomes than concentrating it in one expensive one.
This does not, on its own, settle the full economics of ownership once training costs, fee structures, ownership percentages, and resale outcomes are included. It does show that the purchase-price premium at the top end buys less incremental racecourse outcome than most buyers assume.
Same budget. More chances to get it right. This pattern holds across 18,000 horses and eight years of data.
How this shapes the syndicate
This is what the data leads to. Alpha Edge Racing focuses on sourcing yearlings where the balance between price and racecourse outcome is strongest at the buying stage.
Owners can choose how to structure their involvement — from a single position to broader exposure across multiple horses.
The data consistently favours the latter at the acquisition stage. The advantage isn't theoretical. It shows up clearly in the data.
18,422 yearlings sold at Tattersalls and Goffs (2015–2022), linked to UK and Irish racing careers. Horses that raced internationally are excluded. Yearlings with no domestic racing record are excluded (predominantly unnamed yearlings, likely exported). This analysis evaluates purchase-price efficiency against racecourse outcomes. It is not a full net-ownership-return model and does not include training fees, management fees, ownership percentages, or resale proceeds.
ALPHA EDGE RACING
© Alpha Edge Racing • All Rights Reserved
BHA Licensed Syndicate Manager.
Location
St Peter Port, Guernsey
Registered Guernsey Ltd (No. 77482)