Is the sale ring premium built into the price?
Published

Two yearlings by the same sire, out of dams with similar track records. One sells for £25,000. The other for £230,000.
That gap isn't breeding. It's everything else.
We wanted to know if everything else actually matters on the racecourse.
For each of 17,500 yearlings, we built a simple expected price based on two things the market already knows at the time of sale: what the sire's yearlings typically sell for that year, and how the dam's older foals were rated on the track. Anything the horse sells for above or below that estimate is the premium — the market's price for the physical, the consignor, the competition in the ring, the fashion of the moment.
Then we tracked what those horses actually did.
What the data shows
1. The gap between breeding estimate and sale price is large
Price vs breeding estimate | Horses | Avg price paid | Breeding estimate |
|---|---|---|---|
Big discount (below 50%) | 5,802 | £24,931 | £81,458 |
Modest discount (50–80%) | 3,732 | £48,938 | £76,879 |
Around expected (80–120%) | 3,216 | £74,046 | £75,798 |
Modest premium (120–200%) | 2,934 | £110,668 | £72,829 |
Big premium (over 200%) | 1,824 | £229,294 | £75,122 |
The discount group: sire and dam said £81,000. The market said £25,000.
The premium group: breeding said £75,000. The market said £229,000. A 9x price difference for horses the breeding couldn't separate.
2. The premium horses are genuinely better
Price vs breeding estimate | Avg rating | Stakes winners | Rated 100+ |
|---|---|---|---|
Big discount | 74.0 | 2.1% | 3.5% |
Modest discount | 76.9 | 3.2% | 5.7% |
Around expected | 78.3 | 3.7% | 7.8% |
Modest premium | 79.8 | 5.5% | 10.0% |
Big premium | 82.2 | 7.0% | 12.8% |
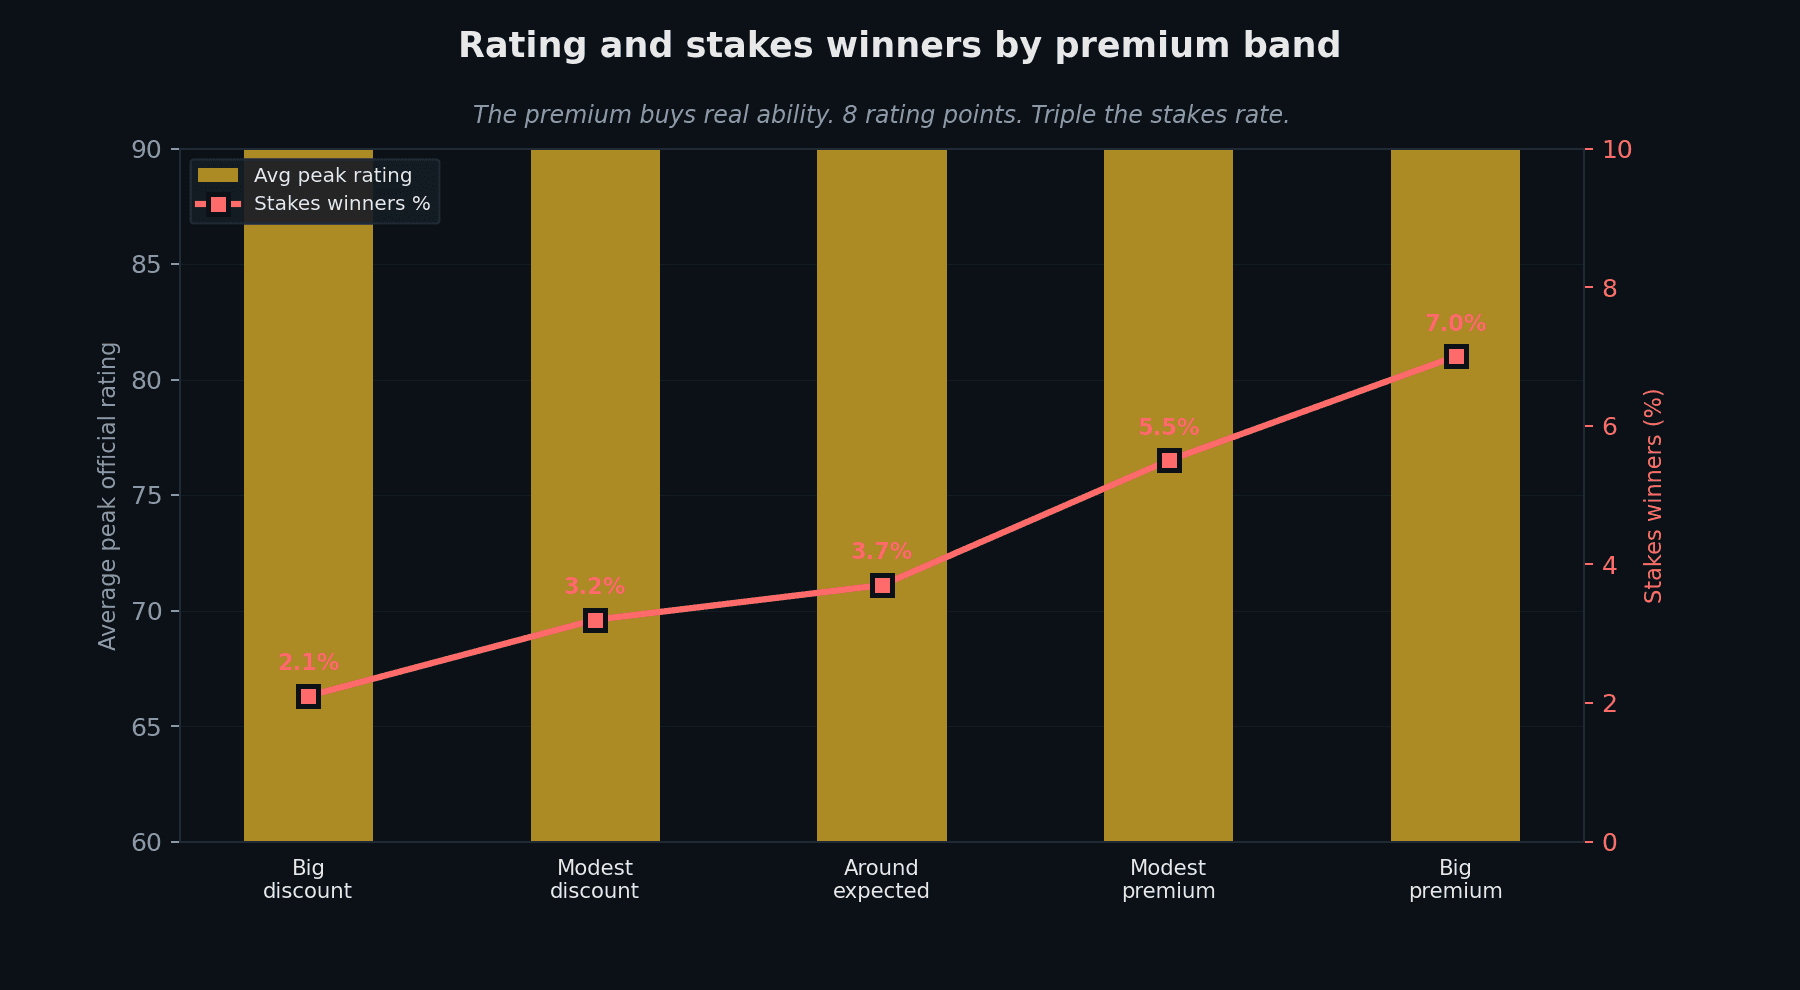
Eight rating points from bottom to top. Triple the stakes winner rate. Whatever buyers see in the ring — the way a horse moves, the depth of its chest, something in the eye — it's not nothing. It correlates with ability. The market is picking up something real beyond the pedigree page.
3. But the price doesn't match the improvement
Here's where it breaks down.
Price vs breeding estimate | Avg price paid | Avg career earnings | Return per £1 | Earn back purchase |
|---|---|---|---|---|
Big discount | £24,931 | £15,419 | 61p | 20.9% |
Modest discount | £48,938 | £20,000 | 40p | 16.0% |
Around expected | £74,046 | £23,631 | 31p | 14.8% |
Modest premium | £110,668 | £30,197 | 27p | 12.5% |
Big premium | £229,294 | £33,037 | 14p | 12.6% |
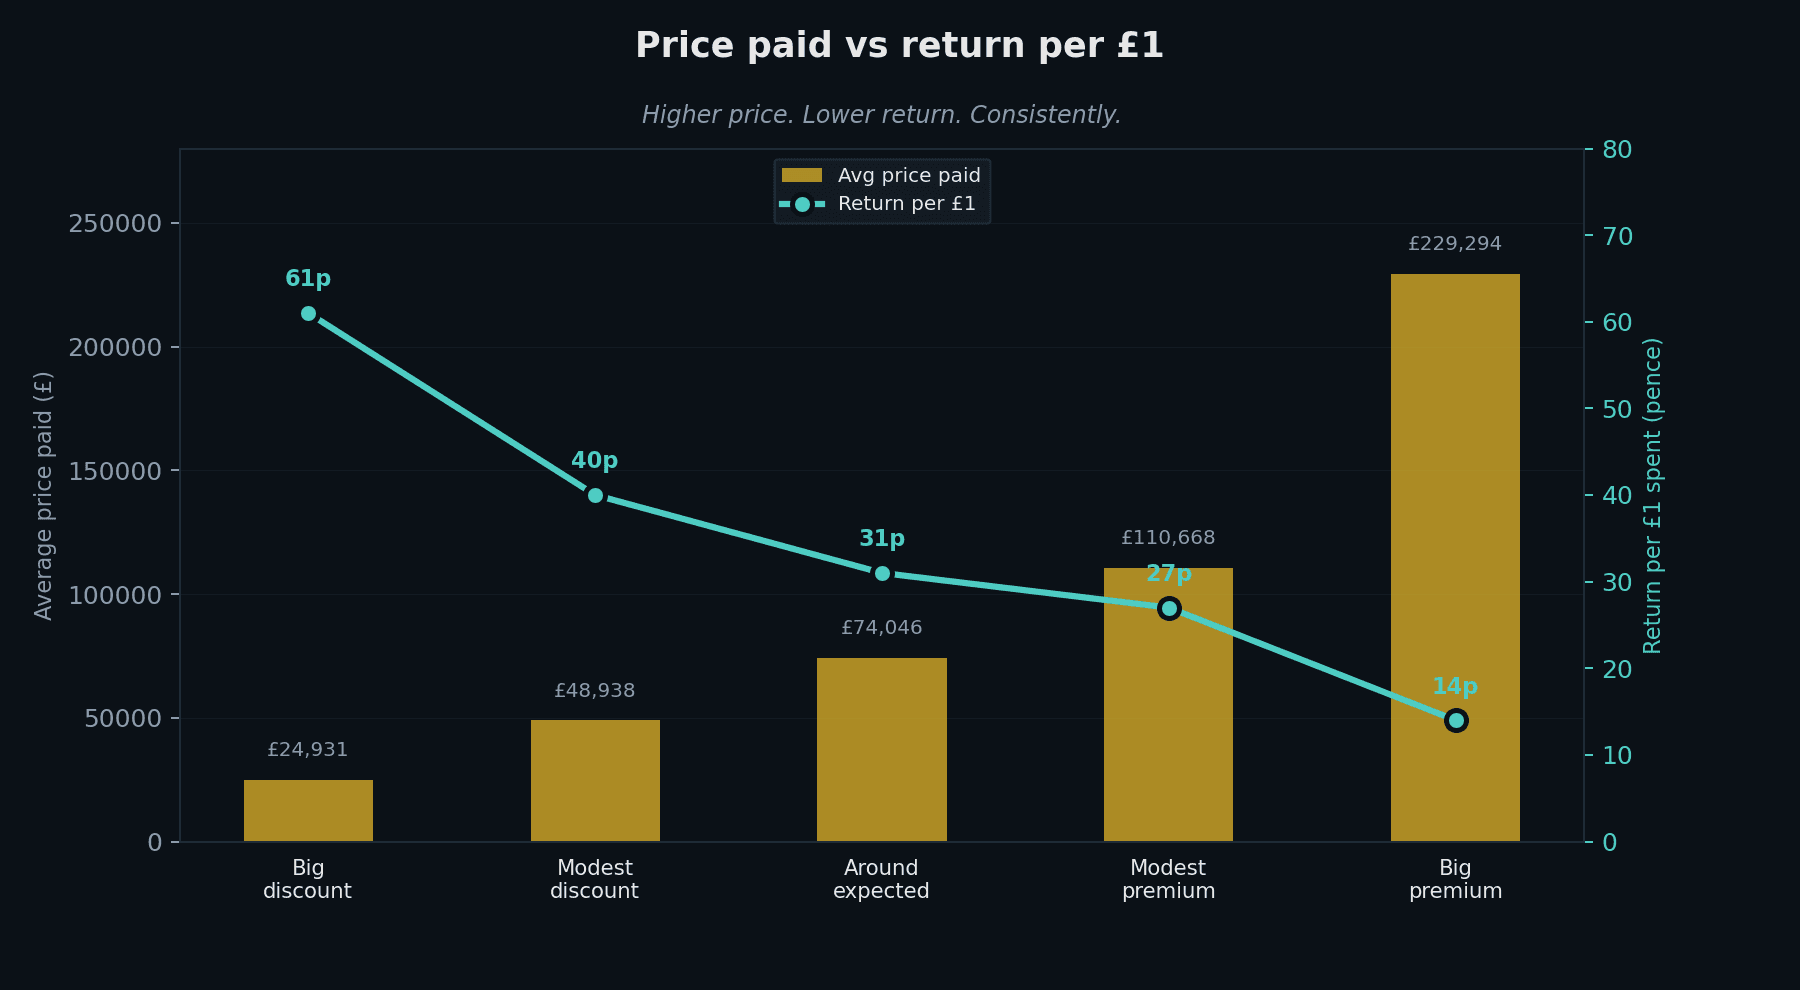
Double the earnings. Nine times the price. That's the whole story in two numbers.
The rating gap is 8 points. The price gap is £204,000. Return per £1 drops from 61p to 14p. One in five discount horses earns back its purchase price. At the premium end, one in eight does — and they cost nine times as much to begin with.
The quality is real. The pricing of that quality is not.
4. The trade-off is variance
Price vs breeding estimate | Wipeout (<£1k earned) | Solid (£10–50k) | Good (£50k+) |
|---|---|---|---|
Big discount | 35.1% | 26.5% | 6.4% |
Modest discount | 24.6% | 31.6% | 8.7% |
Around expected | 22.6% | 33.5% | 10.5% |
Modest premium | 20.3% | 35.8% | 12.9% |
Big premium | 17.4% | 35.6% | 15.1% |
One in three discount horses earns almost nothing. One in six at the premium end. More wipeouts, more horses rated in the 60s, more that never win.
That's the honest cost of buying below the market's estimate. You get more failures.
But when one works — Bradsell (£12,000, rated 119, earned £1.12m), Emily Upjohn (£60,000, rated 121, £1.28m), Harry Angel (£44,000, rated 125, £873,000) — the return per pound isn't close. The premium end can't touch it.
The variance is the price of admission. One horse, it's a gamble. Several horses, it's a strategy.
What this means
The market is good at spotting quality. It sees things in the ring that pedigree doesn't capture, and those things matter. The premium horses are better racehorses. That's not in question.
What is in question is the maths. Eight rating points for £204,000. Double the prize money for nine times the outlay. The market identifies the better horse correctly — then overcharges for it to a point where the returns no longer make sense.
Most of the industry accepts this because they're not playing the same game. At the top end, people are buying prestige, buying into fashion, buying a story. That's fine. But it's a different game from trying to make the numbers work.
For anyone playing the returns game, the data consistently points the same way. Buy where the breeding is right and the price is wrong.
How we use this
We look for yearlings the market underpriced. Horses by proven sires, out of mares whose older foals ran to a decent level, that sold below what those two factors would suggest.
More than a third won't work. The model is built around that — not one horse carrying the whole thing, but enough that the failures get absorbed and the ones that run above their price make up the difference.
The value isn't in the lots everyone wanted.
It's in the ones they walked past.
17,508 yearlings sold at Tattersalls and Goffs (2015–2022), linked to UK and Irish racing careers. Expected price derived from sire's year-specific market average and dam's older-sibling peak official ratings (leave-one-out, using only foals born before the subject horse). Horses with no UK or Irish racing record are excluded.
ALPHA EDGE RACING
© Alpha Edge Racing • All Rights Reserved
BHA Licensed Syndicate Manager.
Location
St Peter Port, Guernsey
Registered Guernsey Ltd (No. 77482)